
Lipi — GoCharting's
Scripting Engine
Write custom indicators, strategy automations and data visualisations directly on the chart. Native access to orderflow metrics, COT data and a community of 7,000+ shared scripts.
Lipi is a powerful and flexible scripting language built directly into GoCharting. With access to orderflow metrics, COT data and a thriving community library, Lipi is the most capable scripting engine available in any web-based trading platform. No installs, no plugins — just open the Script Editor and start coding.
What You Can Build
Key Features
- ✓ Full API documentation with examples and code snippets
- ✓ Indicator-on-indicator support — chain multiple scripts together
- ✓ Plot shapes, labels, lines, filled areas and backgrounds from code
- ✓ Alert conditions defined in script — fires on chart or via notification
- ✓ Save and share scripts from the cloud — works across all devices
- ✓ Community support, self-help videos and guided tutorials
Learn & Reference
Community Scripts Showcase
Explore MoreDiscover what traders have built with Lipi. Browse all 7,000+ scripts
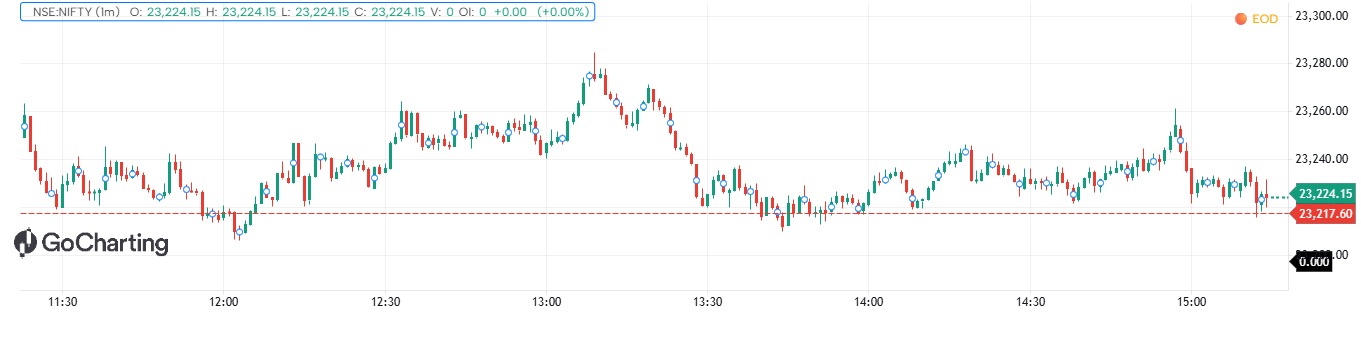
EMA (9+21)
for personal use
used for scalping in nifty 50 , used only for nifty 50
may be errors while live market , used for back testing
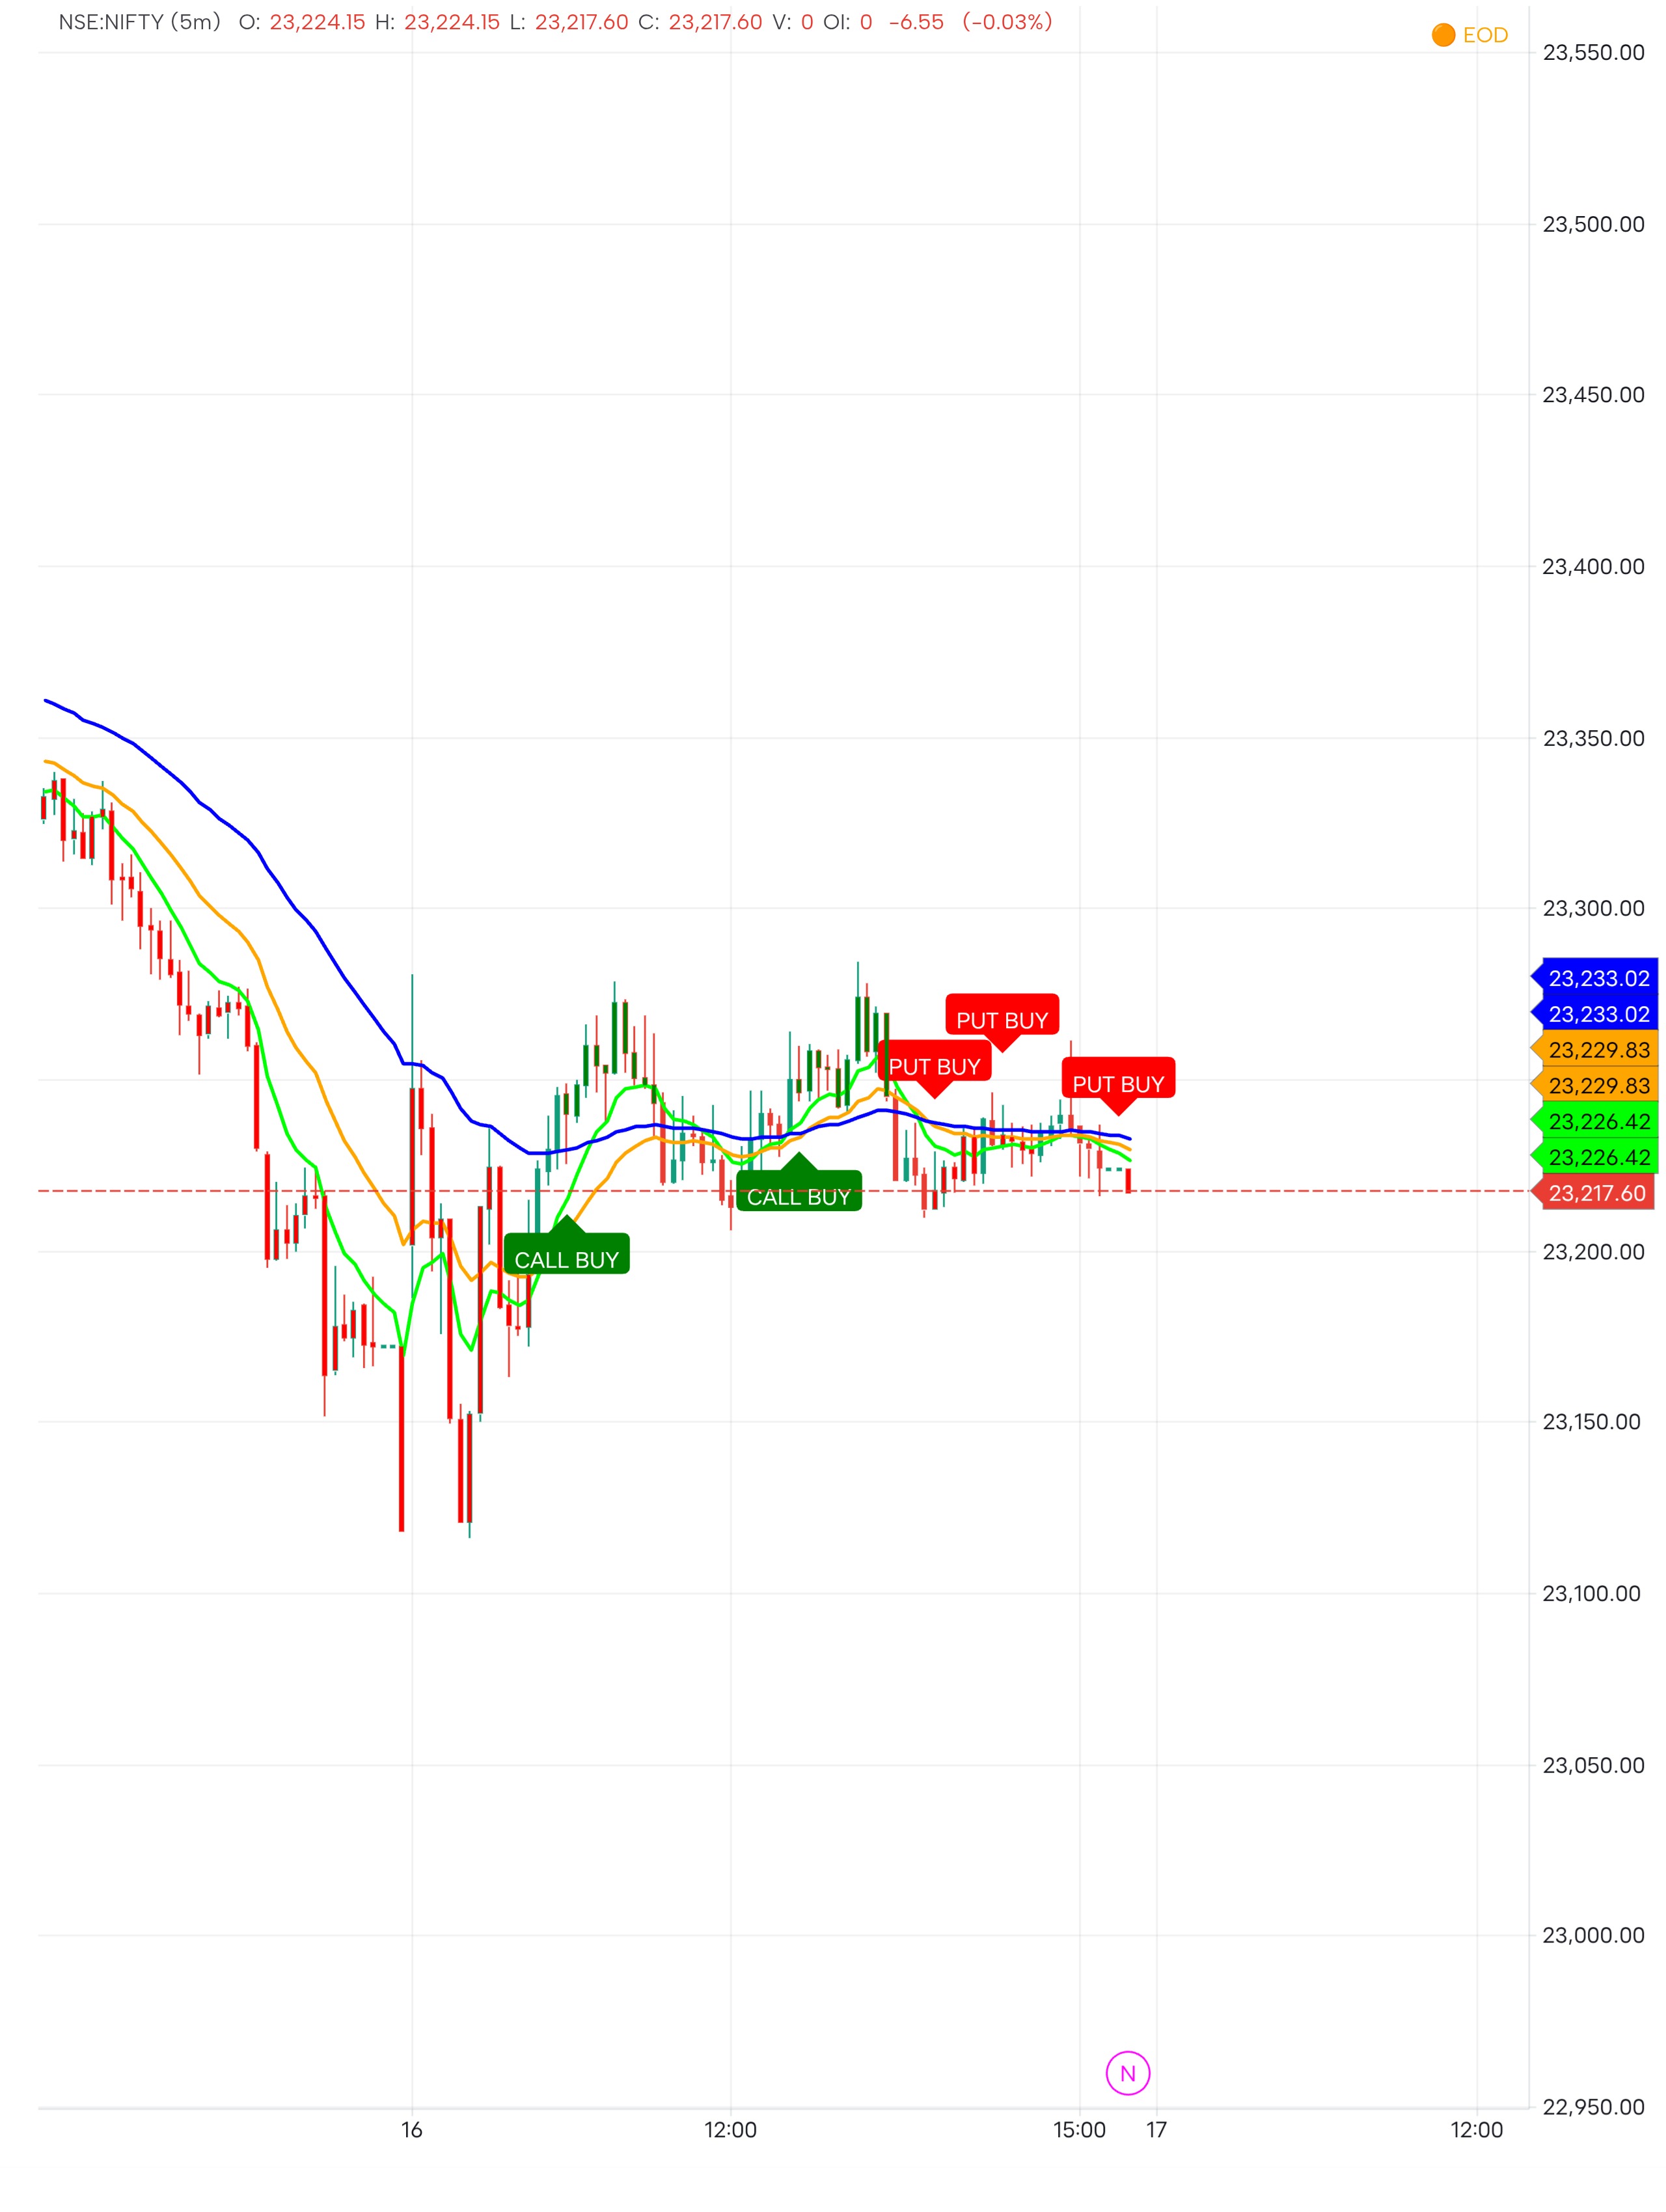
// Smooth Call Put Trend Indicator
indicator("Smooth Call Put Trend", overlay=true)
src = input.source(close, title="Source")
fastLen = input.int(9, title="Fast EMA Length")
slowLen = input.int(21, title="Slow EMA Length")
trendLen = input.int(50, title="Trend EMA Length")
confirmBars = input.int(2, title="Trend Confirmation Bars", minval=1)
atrLen = input.int(14, title="ATR Length")
minGapAtr = input.float(0.10, title="Minimum EMA Gap (ATR)", minval=0.0)
showEma = input.bool(true, title="Show EMAs")
showBars = input.bool(true, title="Color Trend Bars")
fastEma = talib.ema(src, fastLen)
slowEma = talib.ema(src, slowLen)
trendEma = talib.ema(src, trendLen)
atrValue = talib.atr(atrLen)
emaGap = math.abs(fastEma - slowEma)
bullBase = fastEma > slowEma and close > trendEma and emaGap >= atrValue * minGapAtr
bearBase = fastEma < slowEma and close < trendEma and emaGap >= atrValue * minGapAtr
bullConfirmed = bullBase and bullBase[1]
bearConfirmed = bearBase and bearBase[1]
bullSignal = bullConfirmed and not bullConfirmed[1]
bearSignal = bearConfirmed and not bearConfirmed[1]
plot(showEma ? fastEma : na, title="9 EMA", color=color.lime, linewidth=2)
plot(showEma ? slowEma : na, title="21 EMA", color=color.orange, linewidth=2)
plot(showEma ? trendEma : na, title="Trend EMA", color=color.blue, linewidth=2)
plotshape(bullSignal, title="CALL BUY", shape=shape.labelup, location=location.belowbar, color=color.green, text="CALL BUY", textcolor=color.white, size=size.small)
plotshape(bearSignal, title="PUT BUY", shape=shape.labeldown, location=location.abovebar, color=color.red, text="PUT BUY", textcolor=color.white, size=size.small)
barTrendColor = bullConfirmed ? color.green : bearConfirmed ? color.red : na
barcolor(showBars ? barTrendColor : na)
if bullSignal {
alert("CALL BUY: Smooth bullish trend confirmed")
}
if bearSignal {
alert("PUT BUY: Smooth bearish trend confirmed")
}
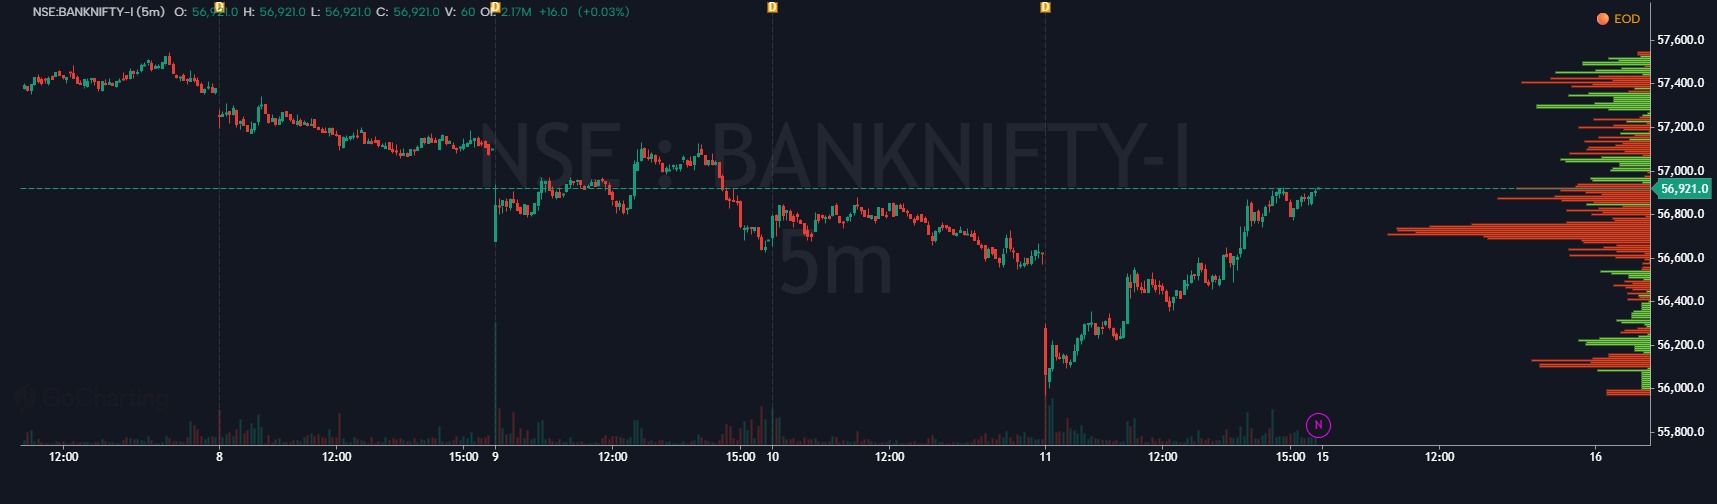
Fades price stretched from the max-pain OI magnet, confirmed by contrarian options flow, with the session Volume-Profile POC as confluence + target. Research killed the OI-levels myth; kept the real mean-reversion edge (~73% win, marginal net → forward-testing). Ships with live-GEX compute, weekly backtest, first-signal watcher, and a TradingView overlay that auto-syncs its levels.
This indicator plots the fair value gaps and Inverted Fair value gaps. There is option to select the number of bars till which the FVG hss to be tracked. There is also an option to select the number of FVG bars on each side.
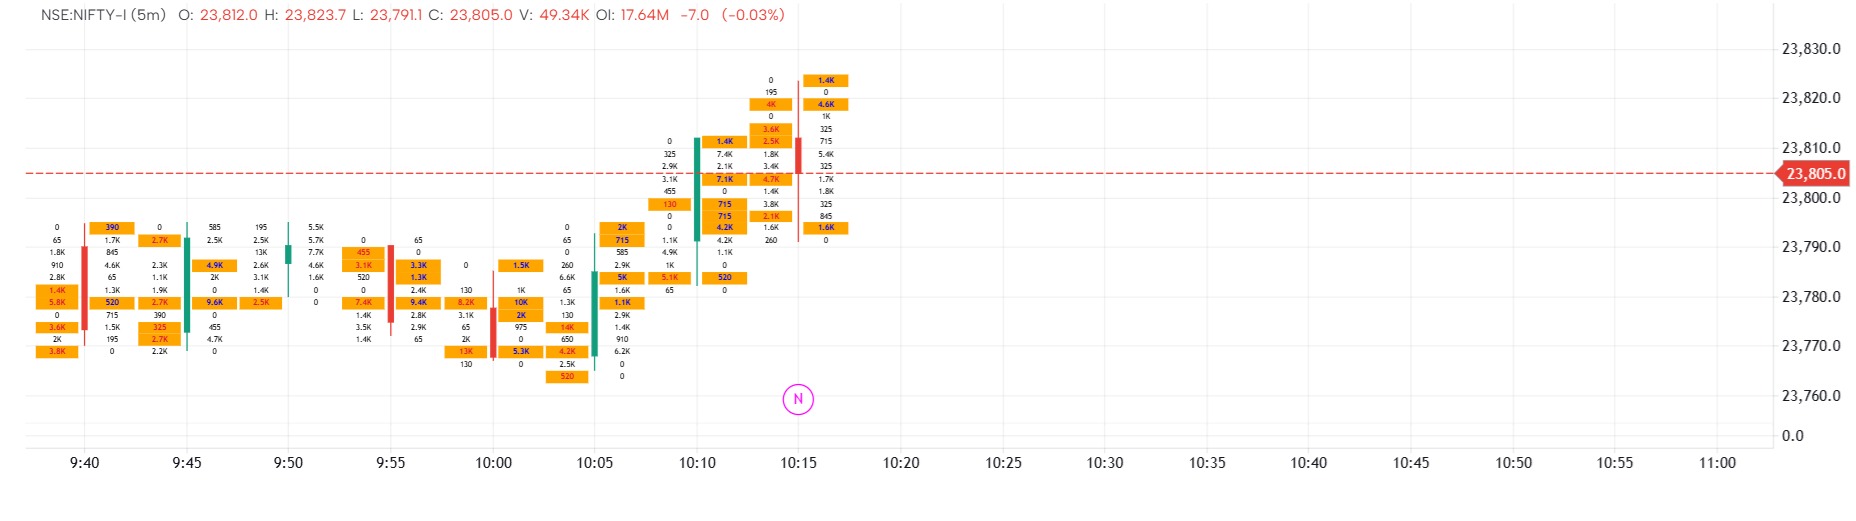
This indicator plats the support and resistance level based onthe pivot levels reached. There is an option to increase the pivot strength and maximum lines per side can also be configured. Also if a support are resistance is broken you have an option to display those levels or remove it.
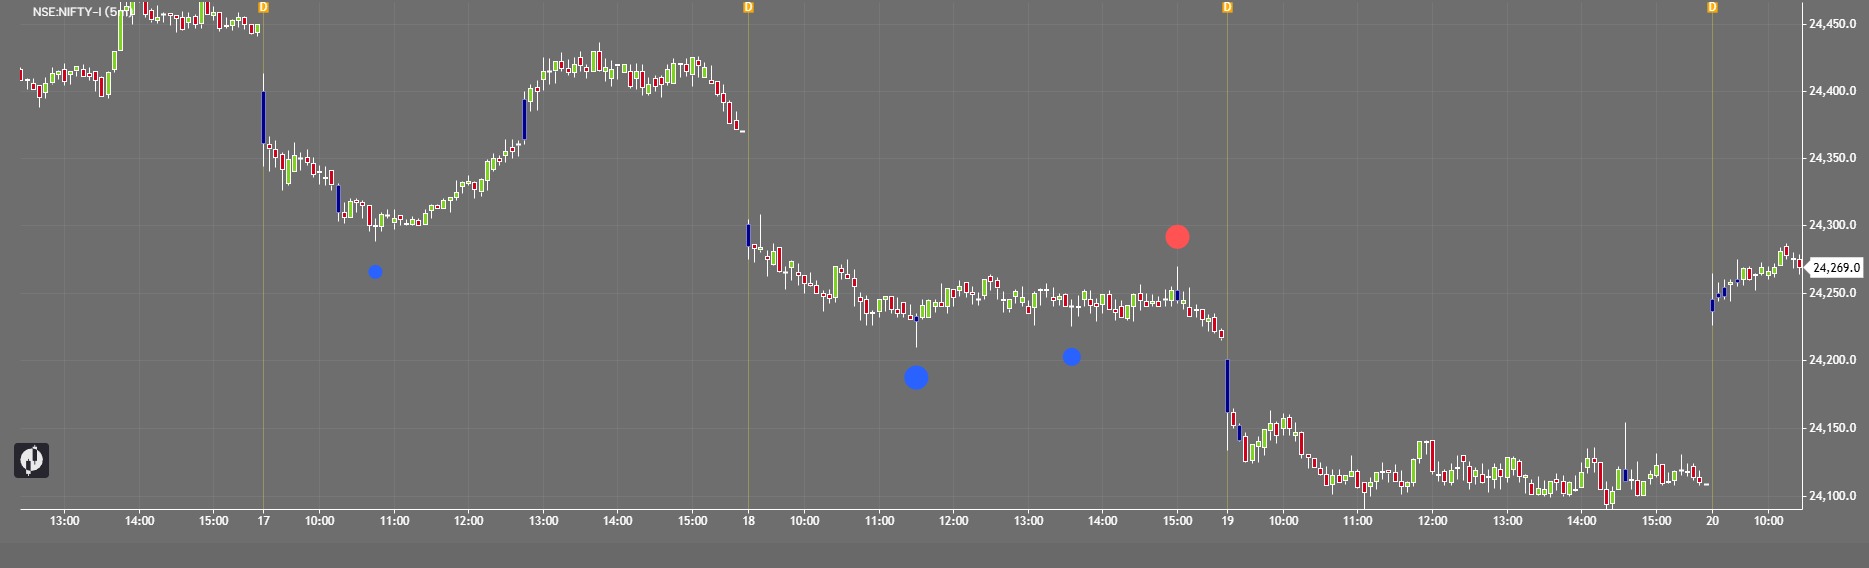
Find critical volume candles and identify potential breakout or breakdown zones with ease.
Set the Volume or Delta threshold according to your trading strategy. When the candle’s volume crosses your selected level, the indicator automatically highlights that candle in blue.
You can use the highlighted candle’s High and Low as a reference range. Drag or extend this range on the chart and watch for a breakout above the candle high or breakdown below the candle low.
These critical candles can help you identify areas of strong market participation and potential order-flow movement, giving you a clearer view of where a strong move may develop.
How to use:
🔹 Set your desired Volume/Delta level
🔹 Wait for a candle to cross the selected threshold
🔹 The critical candle is highlighted in blue
🔹 Mark the candle High–Low range
🔹 Break above High = potential bullish flow
🔹 Break below Low = potential bearish flow
Trade with confirmation and proper risk management. This indicator is a tool for market analysis, not financial advice.
CRT ALGODescription — CRT Master GoCharting
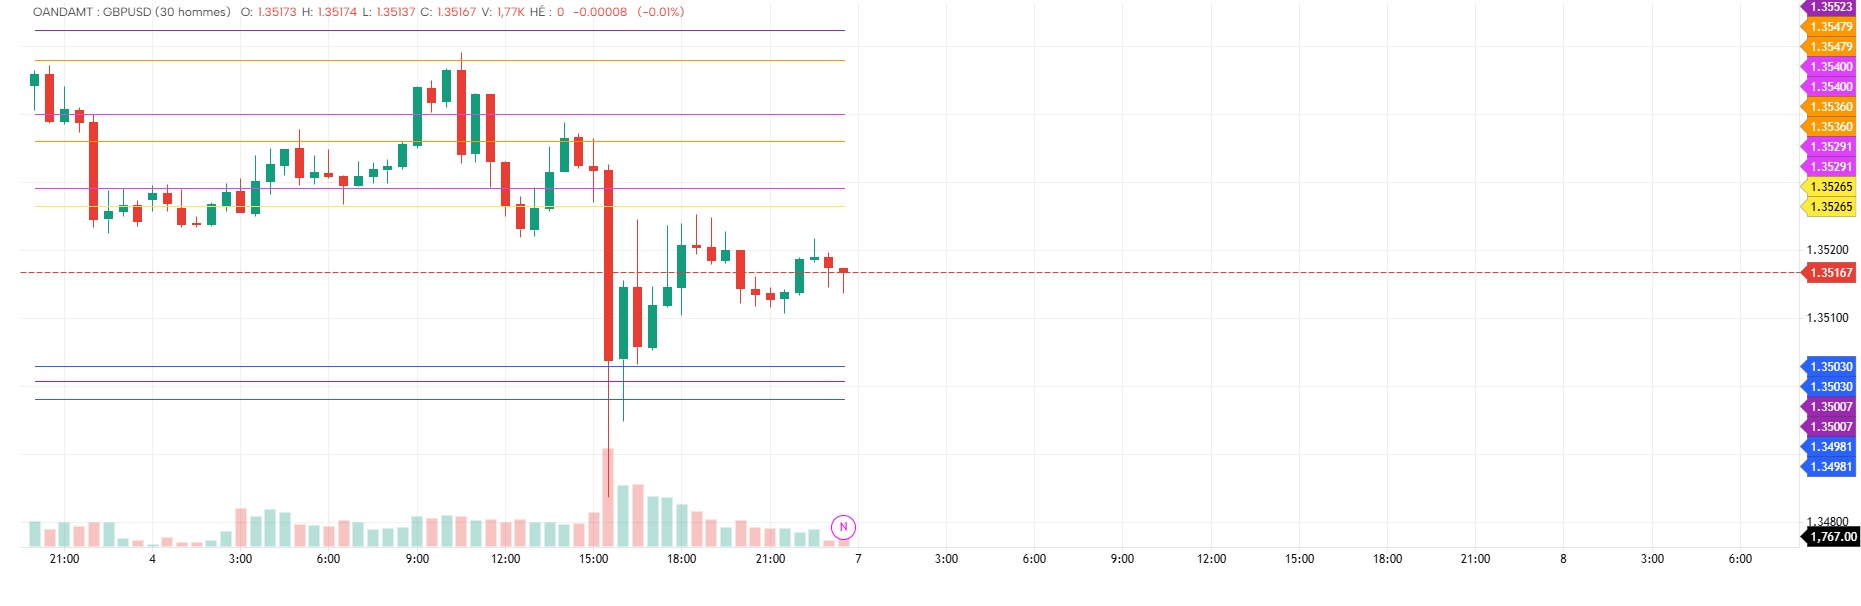
CRT Master GoCharting est un indicateur basé sur la stratégie Candle Range Theory (CRT). Il identifie automatiquement les zones CRT, les phases de purge (liquidity sweep) et les bougies de confirmation afin de détecter des opportunités BUY / SELL.
Fonctionnalités :
🟠 CRT Vendredi → Purge Lundi
🟣 CRT Lundi → Purge Mardi
🟠 CRT Dimanche → Purge Lundi
Détection automatique du CRT High / CRT Low
Détection de la Purge High / Purge Low
Calcul du niveau 50% du CRT
Confirmation sur la bougie H4 suivant immédiatement la purge
Génération des signaux BUY / SELL
Calcul automatique de Entry, TP1, TP2 et SL
Affichage graphique avec des lignes fines pour faciliter la lecture du graphique.
Logique principale :
Après la formation du CRT, l'indicateur attend une cassure du High ou Low du CRT. Cette cassure constitue la purge. La bougie H4 suivante est ensuite utilisée comme bougie de confirmation avant d'afficher le signal.
BUY : purge du CRT Low → confirmation sur la bougie H4 suivante.
SELL : purge du CRT High → confirmation sur la bougie H4 suivante.
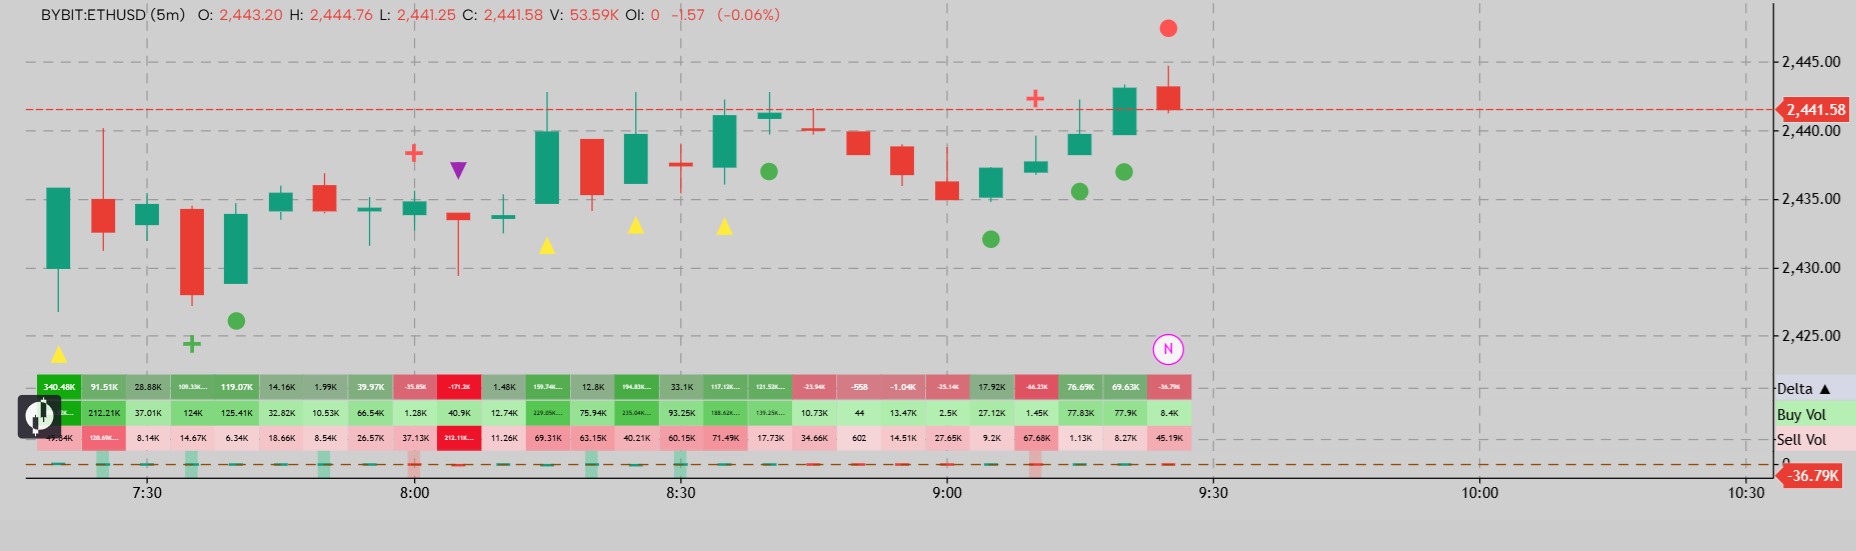
Highlighting of strong buyer and seller candles based on the strength of the opposing volume within each candle. The purpose is to identify candles where one side clearly dominates despite the presence of opposite-side trading activity. A strong buyer candle is identified by evaluating the buy volume relative to the sell volume within the same candle, while a strong seller candle is identified by comparing the sell volume against the corresponding buy volume. This helps distinguish genuinely dominant buying or selling pressure from candles where the volume is more balanced between both sides.
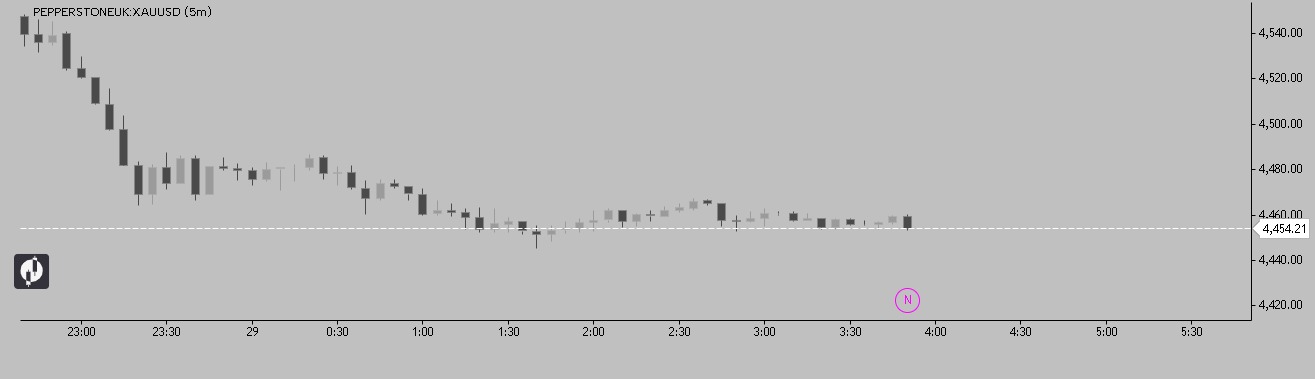
momentum candle by rizki aditama sekolah trading .............................................................................................
momentum candle adalah suastu candle besar dengan ekor kecil
Daily • Weekly • Monthly Opens
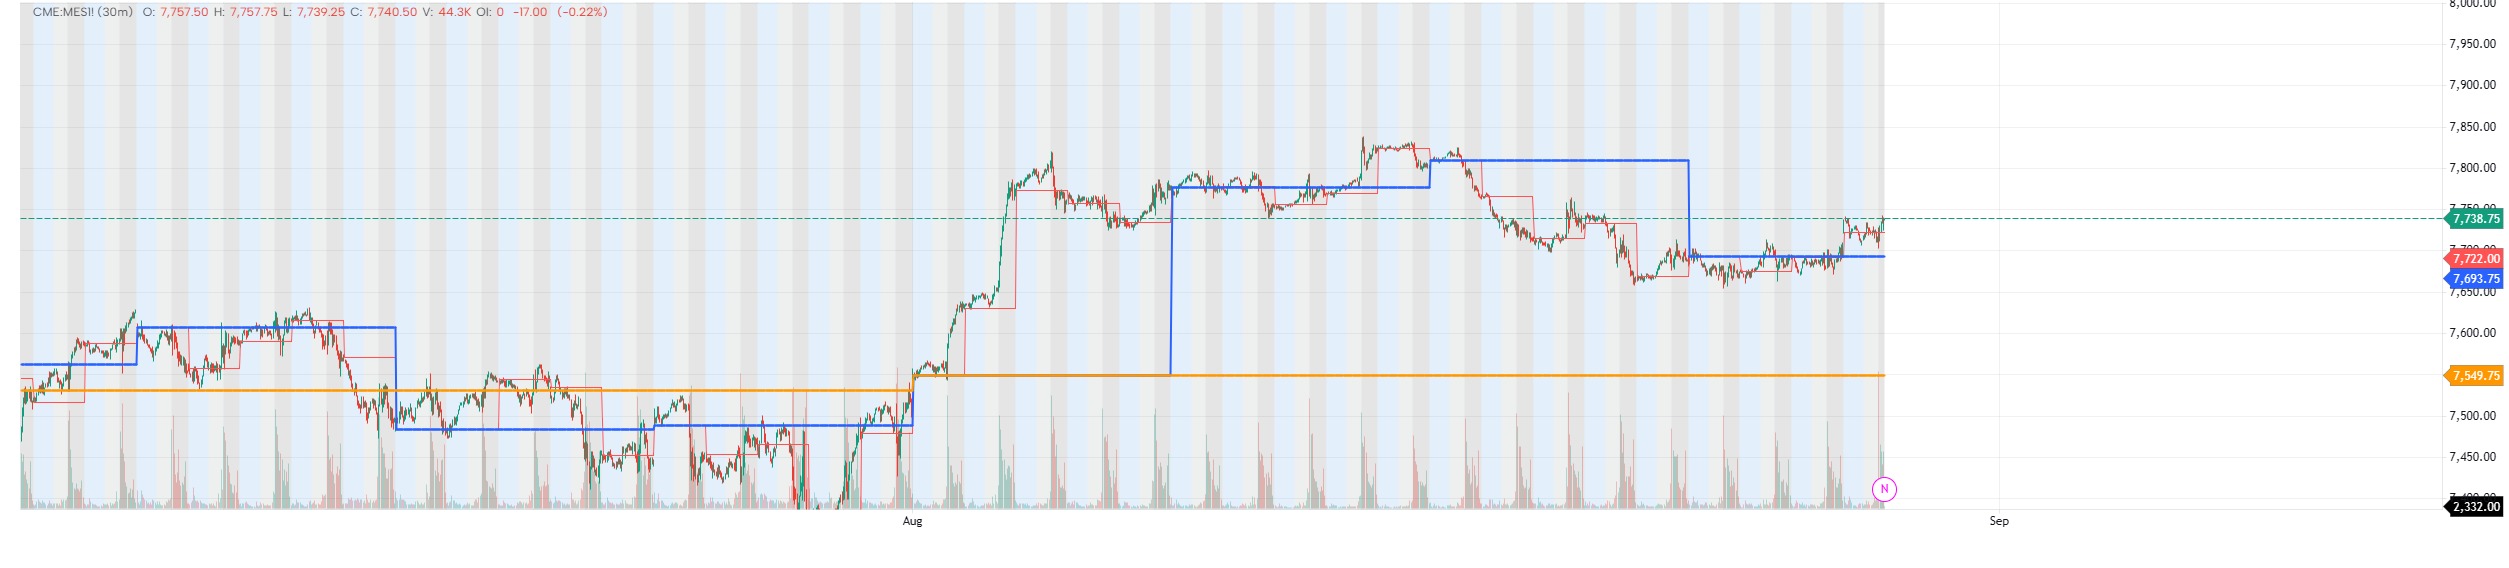
Markets do not begin at random. Every new day, week and month starts a fresh auction. In Auction Market Theory the open is not decoration. It is the start of price discovery for that timeframe. An open inside prior value often precedes rotation. An open outside prior value with conviction often precedes imbalance. Alignment across monthly, weekly and daily opens raises probability. Conflict between them warns you that you may be trading a counter-move inside a larger auction.
This indicator plots the levels institutions actually use as reference: the Daily Open, Weekly Open and Monthly Open. Price is measured against these anchors so you can see, at a glance, whether the current auction is trading in premium or discount — and whether higher-timeframe structure supports or contradicts the move in front of you.
What it shows
Daily, Weekly and Monthly Opens as persistent reference lines
Optional True Opens
Live premium / discount state relative to each open
Clean, uncluttered overlay that stays readable on lower timeframes
Usage
Use the Monthly Open for swing bias.
Use the Weekly Open for the week’s draw.
Use the Daily Open for session execution.
One framework. Three timeframes.
Use in conjunction with Market Profile indicator for value areas.
Supported Markets
Lipi scripts work across all GoCharting markets — NSE/BSE Futures & Options, CME Futures (/ES, /NQ, /CL, /GC), Forex & Crypto and Indian equities. Orderflow metrics (delta, buy/sell volume, OI) are available wherever the underlying data feed supports them.