Critical Delta & Volume Candle Finder

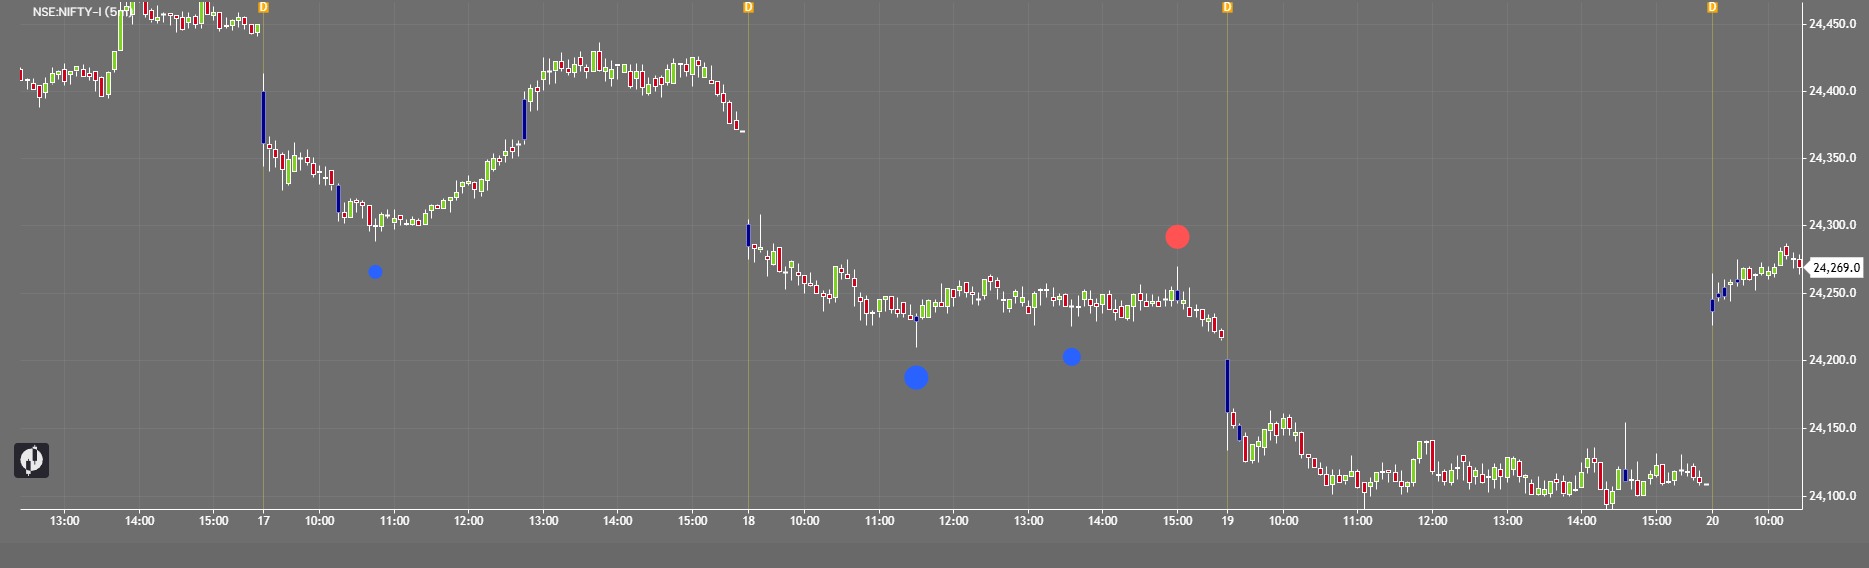
Find critical volume candles and identify potential breakout or breakdown zones with ease.
Set the Volume or Delta threshold according to your trading strategy. When the candle’s volume crosses your selected level, the indicator automatically highlights that candle in blue.
You can use the highlighted candle’s High and Low as a reference range. Drag or extend this range on the chart and watch for a breakout above the candle high or breakdown below the candle low.
These critical candles can help you identify areas of strong market participation and potential order-flow movement, giving you a clearer view of where a strong move may develop.
How to use:
🔹 Set your desired Volume/Delta level
🔹 Wait for a candle to cross the selected threshold
🔹 The critical candle is highlighted in blue
🔹 Mark the candle High–Low range
🔹 Break above High = potential bullish flow
🔹 Break below Low = potential bearish flow
Trade with confirmation and proper risk management. This indicator is a tool for market analysis, not financial advice.
The information and publications are not meant to be, and do not constitute, financial, investment, trading, or other types of advice or recommendations supplied or endorsed by GoCharting. Read more in the Terms of Use.
Comments (3)
Loading comments…