Delta and Cumulative Delta Histogram

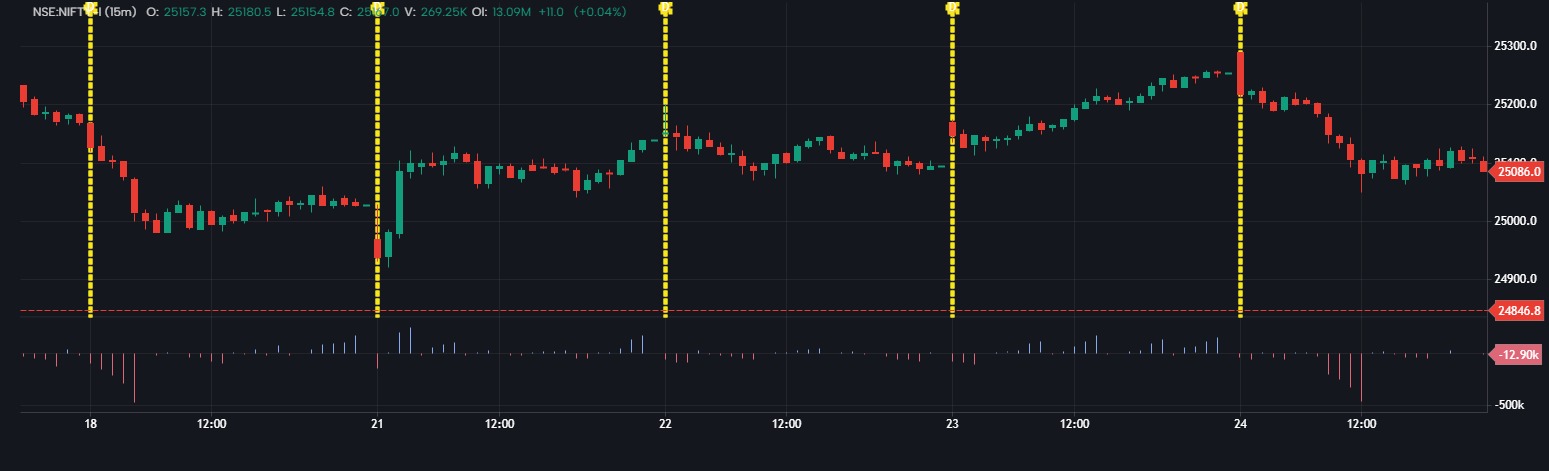
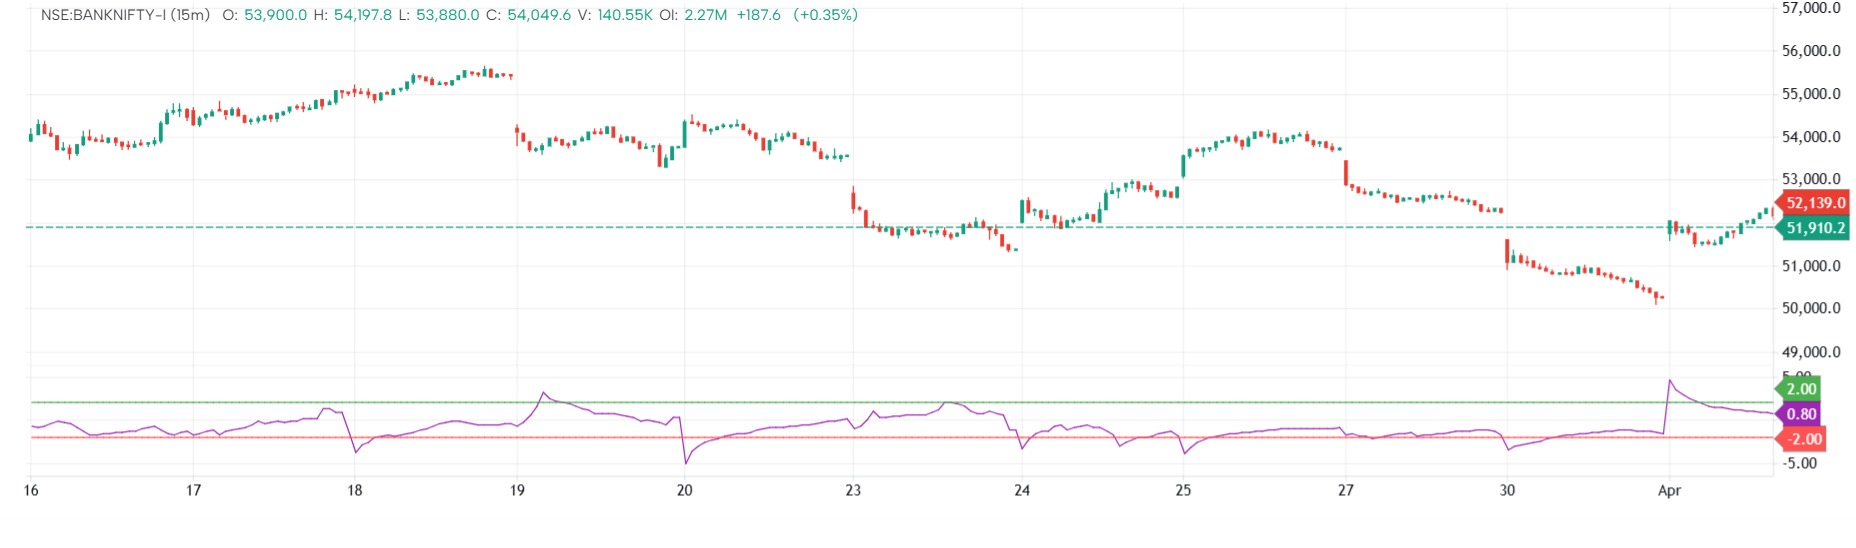
This script visualizes volume delta (difference between buy and sell volume) using either:
Instant delta (per bar), or
Cumulative delta, for trend observation.
⚙️ Key Inputs:
aggr: Toggles between Cumulative vs Per-bar delta display.
ratio: Option to normalize delta as a ratio (buyVolume/totalVolume), adjusted for direction.
colbuy, colsell: Colors for buy and sell delta bars.
📊 How It Works:
Delta Calculation
If ratio is true, delta = buyVolume / volume, then adjusted by sign.
Else, raw delta = buyVolume - sellVolume.
Cumulative Delta (cdelta)
Accumulates delta only when direction is consistent (both current and previous deltas are either positive or negative).
Resets if the direction changes.
Plotting
If aggr is ON → plots cdelta as a histogram.
If aggr is OFF → plots raw delta as histogram.
📈 Use Case:
Ideal for orderflow traders and volume-based strategies.
Helps identify momentum shifts, buy/sell pressure trends, and divergences.
The information and publications are not meant to be, and do not constitute, financial, investment, trading, or other types of advice or recommendations supplied or endorsed by GoCharting. Read more in the Terms of Use.
Related Scripts
Comments (1)
Loading comments…