Vwap Delta

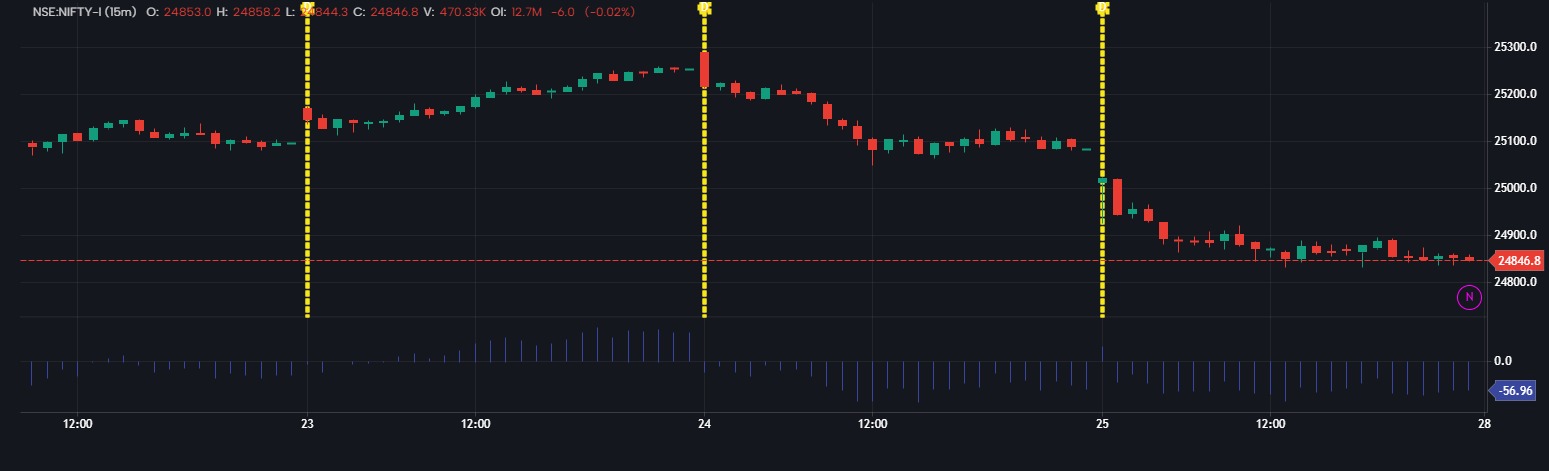
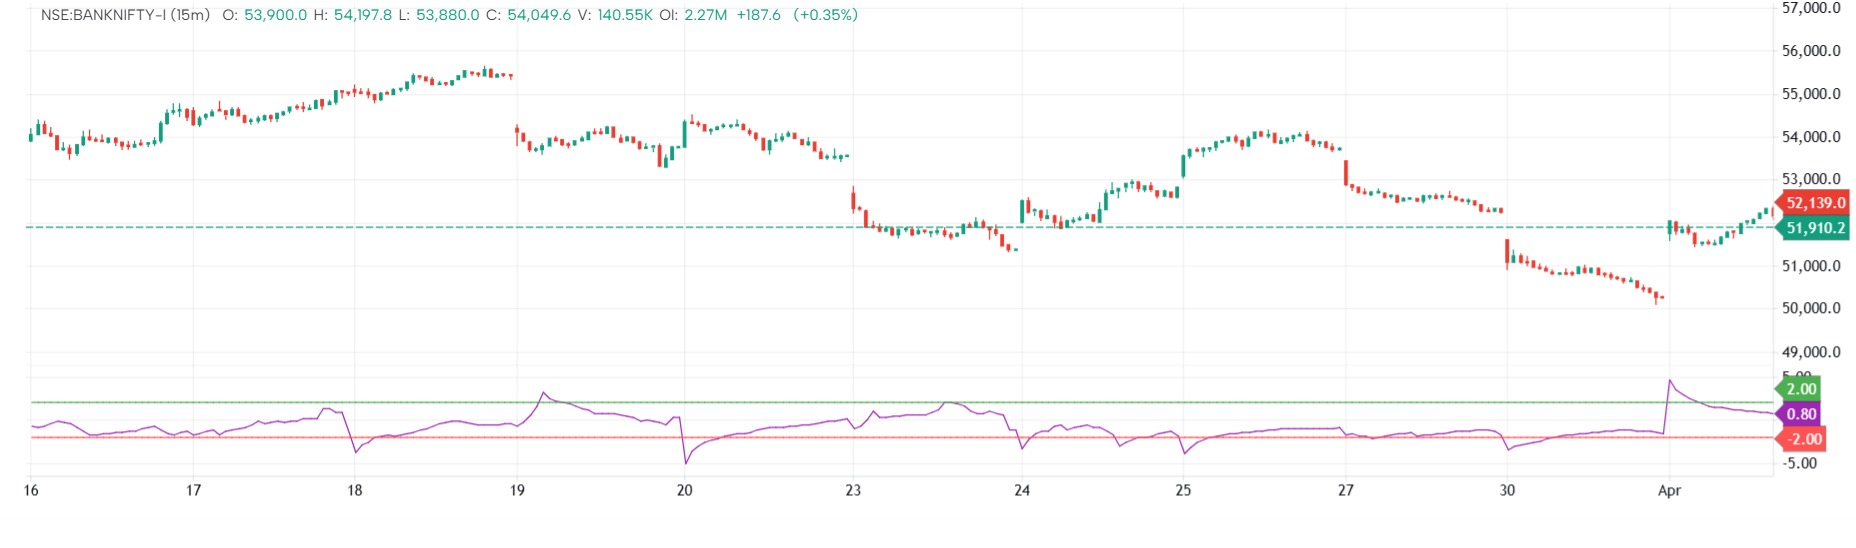
This script calculates the delta between the close price and the VWAP (Volume Weighted Average Price) over a custom-defined period (currently only "Day" is supported).
⚙️ How it works
User Inputs:
period: Only "Day" is supported (input as string).
filter: A threshold (default 3000) to color the background if the VWAP delta exceeds it.
Period Detection:
Uses dayofweek to detect when a new trading day begins.
VWAP Calculation:
VWAP is calculated using cumulative values of (hlc3 * volume) and volume, reset each new day.
Delta Logic:
Computes vwapDelta = close - vwap
Highlights background in gray if vwapDelta exceeds the filter (positive or negative).
Visualization:
Plots the delta as a histogram, useful for visualizing deviations from VWAP.
✅ Strengths:
Straightforward day-based VWAP delta logic.
Clean visual output with background highlighting for large deltas.
⚠️ Suggestions:
Currently, only "Day" is supported. Add more period logic if needed (e.g., "Week", "Month").
Variable sumSrcSrcVol is unused; either remove or complete its logic for VWAP standard deviation.
The filter value of 3000 seems high unless you're working with large-priced assets. Consider scaling it relative to price if needed.
The information and publications are not meant to be, and do not constitute, financial, investment, trading, or other types of advice or recommendations supplied or endorsed by GoCharting. Read more in the Terms of Use.
Related Scripts
Comments (1)
Loading comments…