CVD++

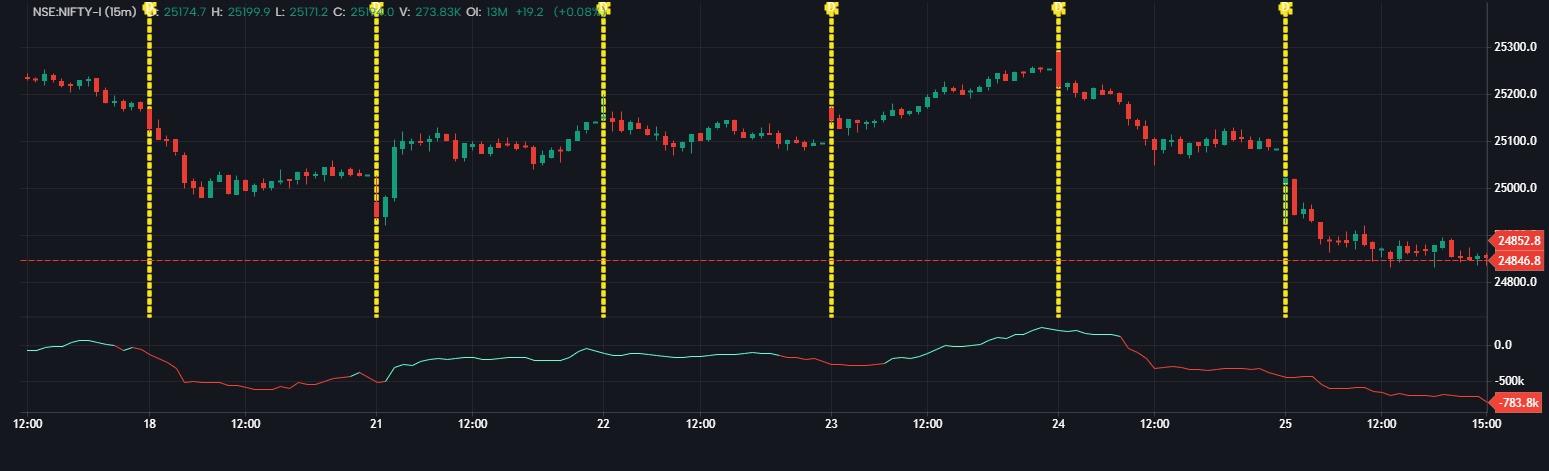
📊 Indicator Name: CVD
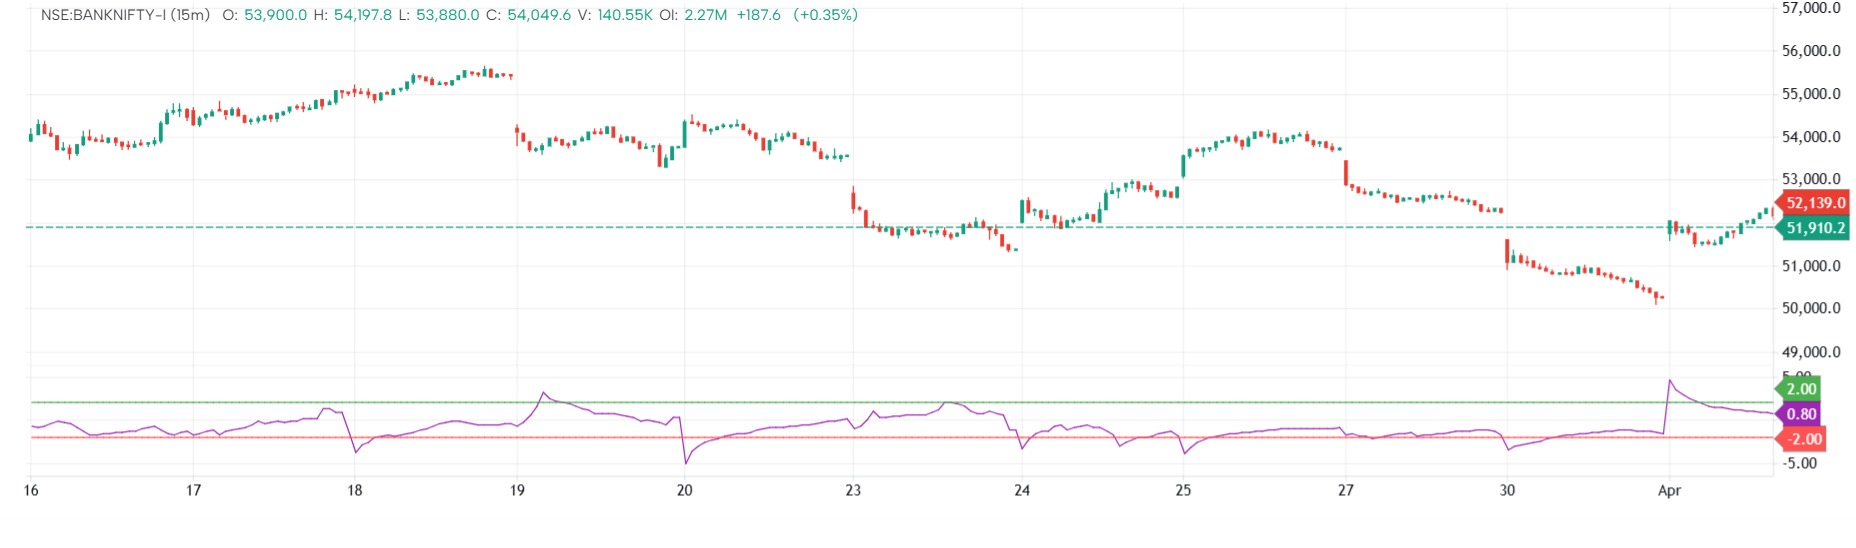
This indicator visualizes the Cumulative Volume Delta (CVD) with an optional histogram mode for momentum analysis.
🔍 Core Components
Cumulative Volume Delta (CVD):
Calculated as the cumulative sum of the difference between buy and sell volume (buyvolume - sellvolume).
Tracks real-time market buying vs. selling pressure.
Exponential Moving Average (EMA):
A smoothing line (eCVD) applied to the CVD using the user-defined length.
Helps assess the trend direction or mean value of the CVD.
Histogram Mode (Optional):
If enabled, plots the difference between the CVD and its EMA (CVD - eCVD) as a histogram.
Useful for identifying momentum shifts, like when delta moves strongly away from its average.
Color Coding:
Green/Up Color: Positive momentum (CVD > EMA).
Red/Down Color: Negative momentum (CVD < EMA).
🎯 Use Case:
This indicator helps traders:
Visualize volume pressure dynamics over time.
Spot momentum shifts via histogram mode.
Confirm trends or potential volume-based reversals.
The information and publications are not meant to be, and do not constitute, financial, investment, trading, or other types of advice or recommendations supplied or endorsed by GoCharting. Read more in the Terms of Use.
Related Scripts
Comments (0)
Loading comments…