Volume Delta Size

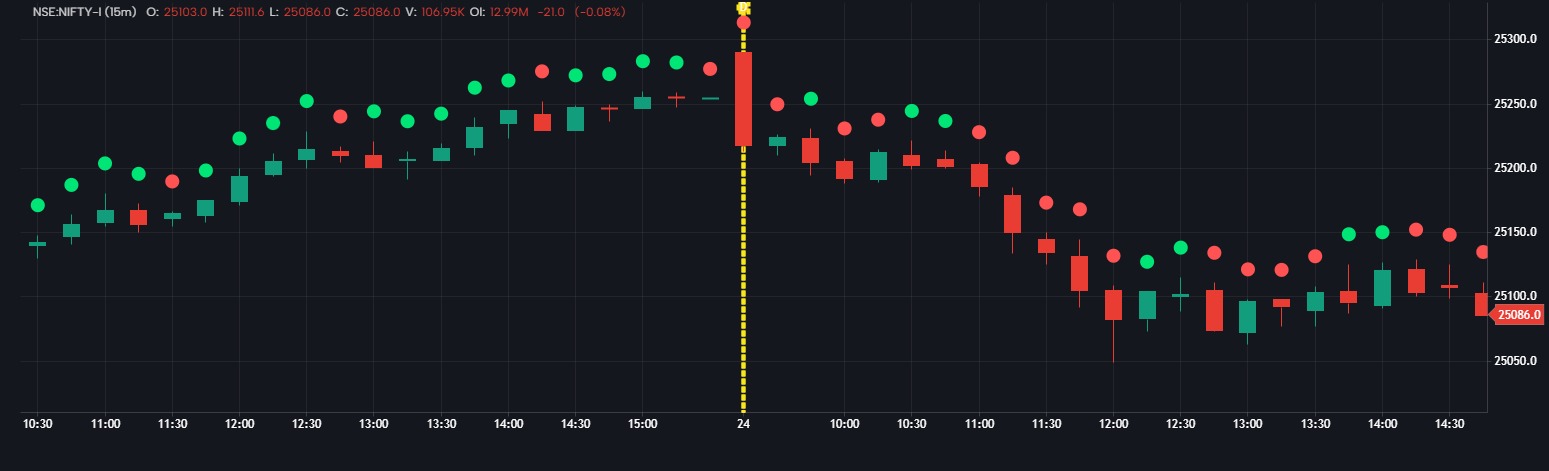
To visually highlight the strength and direction of delta (buy vs sell volume difference) using colored circles on the price chart.
⚙️ Key Inputs:
d: Volume delta = Buy volume – Sell volume.
balance: Normalizing factor to scale delta.
distance: Vertical offset to avoid overlapping the price.
color_p / color_n: Circle colors for positive or negative delta.
📊 What It Does:
Computes a scaled delta size (d_size).
Draws a circle above the bar (if delta > 0) or below the bar (if delta < 0).
Color-coded to show dominant volume side:
Green (or custom): Buy pressure.
Red (or custom): Sell pressure.
📈 Use Case:
Helps visually confirm volume dominance during up/down moves.
Useful for orderflow analysis, detecting aggressive buyers/sellers.
Enhances entry timing or trend strength evaluation.
The information and publications are not meant to be, and do not constitute, financial, investment, trading, or other types of advice or recommendations supplied or endorsed by GoCharting. Read more in the Terms of Use.
Related Scripts
Comments (0)
Loading comments…