Delta Volume

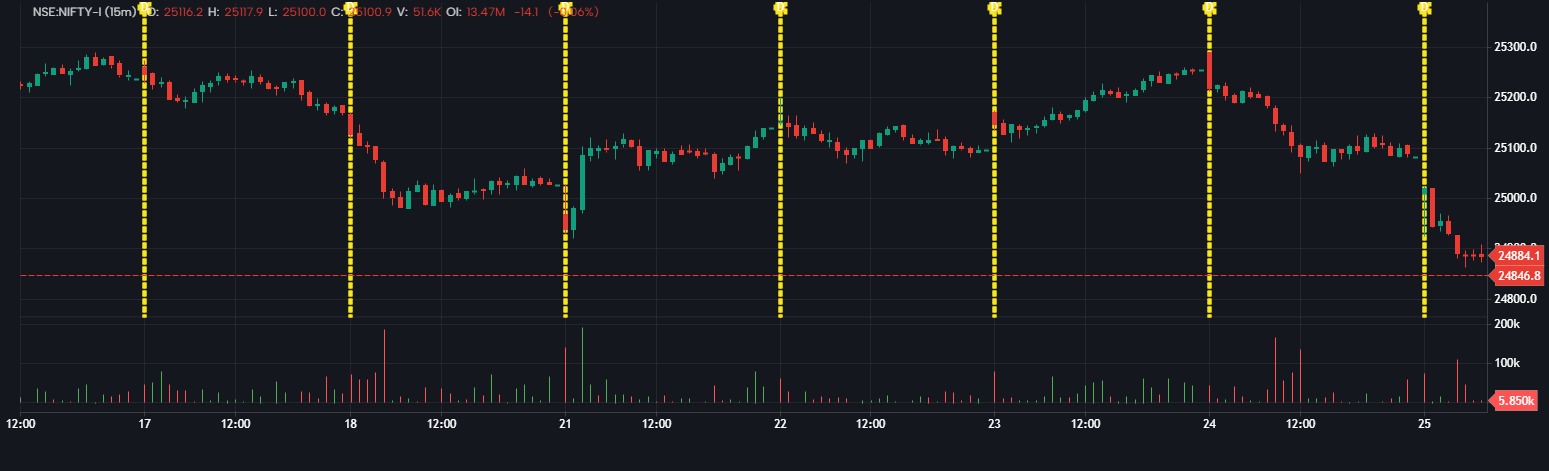
📊 Indicator Name: Delta Volume
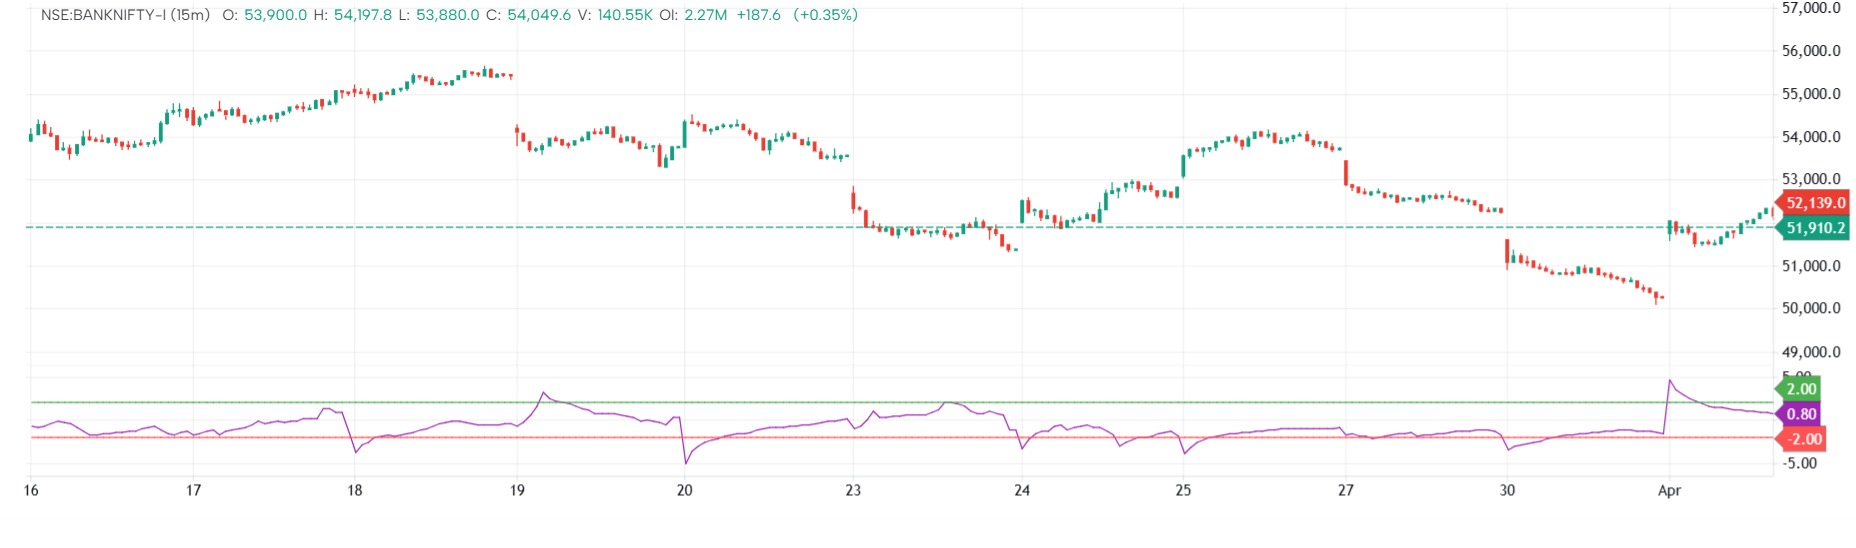
This indicator visualizes the difference between buy and sell volume (Delta Volume) per bar, highlighting market aggression.
🔍 Core Logic:
Delta Volume Calculation
If buy volume > sell volume: delta = buy - sell
Else:
If ssub = false: delta = sell - buy (always positive, shows strength)
If ssub = true: delta = (sell - buy) * -1 (negative when selling dominates)
Color Coding:
Green (#4CAF50) when buying volume dominates.
Red (#FF5252) when selling volume dominates.
Plot: Histogram showing the magnitude and direction of delta volume.
✅ Use Case:
Quick view of buyer vs. seller strength per candle.
Helps identify aggressive buying or selling spikes.
The information and publications are not meant to be, and do not constitute, financial, investment, trading, or other types of advice or recommendations supplied or endorsed by GoCharting. Read more in the Terms of Use.
Related Scripts
Comments (0)
Loading comments…