Delta pt1

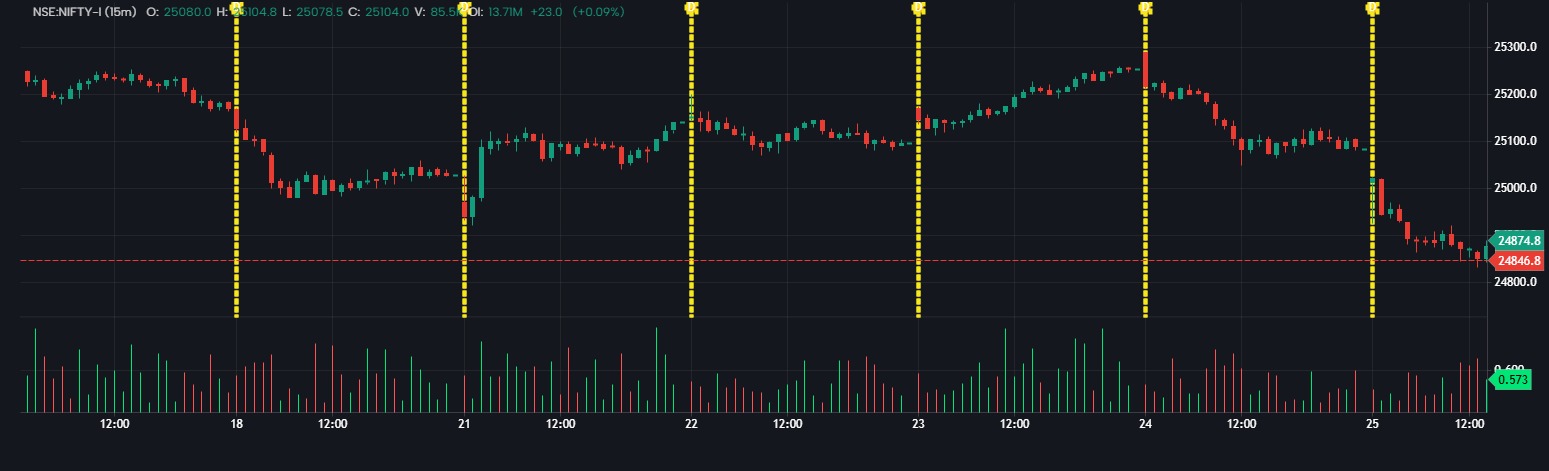
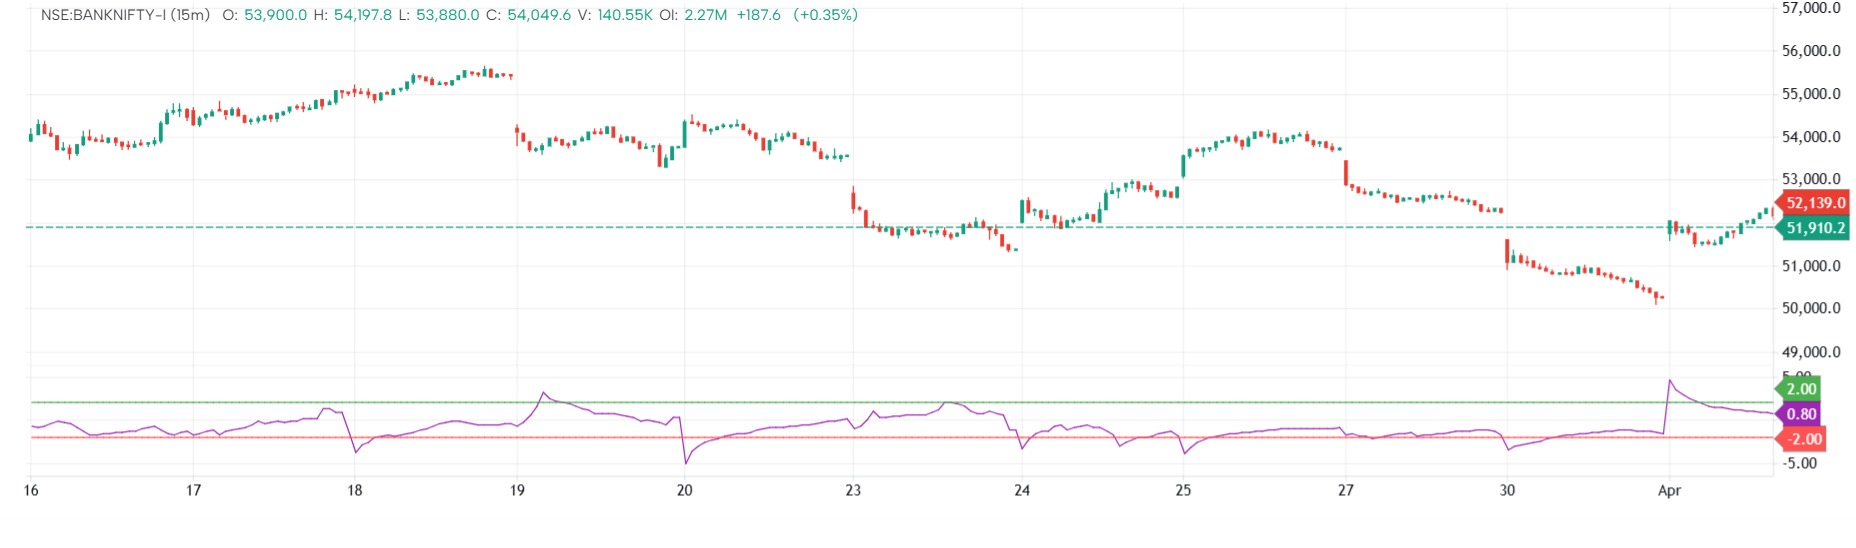
This indicator is a multi-functional orderflow analysis tool for visualizing delta, total volume, delta ratios, and high-low (range) filters, all toggleable with user inputs.
📘 Components:
🔹 Delta & Total Volume
delta = Buy Volume − Sell Volume (net aggression).
total = Buy Volume + Sell Volume (overall activity).
You can toggle these via checkboxes (togDelta, togTotal) and view them as histogram bars.
🔹 Delta Ratios
deltaRatBuy: Buy Volume / Total Volume — shows percentage of buyer dominance.
deltaRatSell: Sell Volume / Total Volume — shows percentage of seller dominance.
Plotted only if ratio exceeds a user-defined filter threshold (filter, default: 50%).
Toggleable with togDeltaRatBuy and togDeltaRatSell.
🔹 High-Low Range Filter
Computes the candle’s range (high - low).
If range exceeds hiloFilter (default 500), it highlights the background using hiloFilterCol.
Toggle with togHilo.
✅ Use Case:
Helps identify volume-driven candles with high delta activity.
Delta ratio filters show if buyers/sellers dominated disproportionately.
High-Low filter isolates significant candles with large price moves.
The information and publications are not meant to be, and do not constitute, financial, investment, trading, or other types of advice or recommendations supplied or endorsed by GoCharting. Read more in the Terms of Use.
Related Scripts
Comments (0)
Loading comments…