Volume Delta MAs

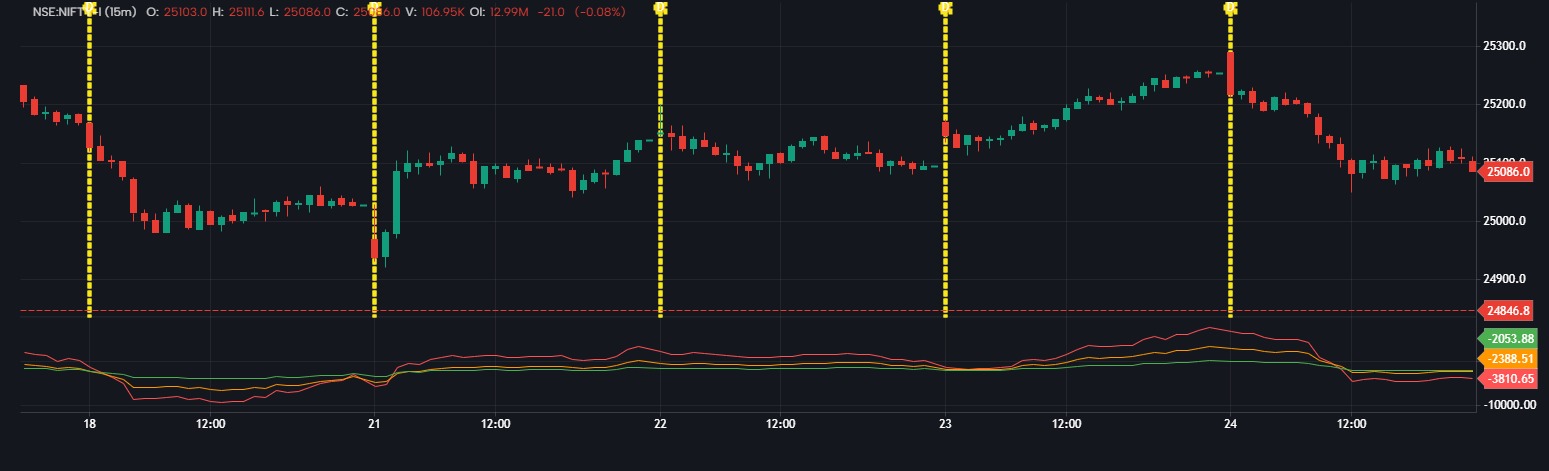
This script analyzes the trend and momentum of buy vs. sell pressure over time by applying moving averages to volume delta.
⚙️ Key Components:
vd: Volume Delta = Buy Volume − Sell Volume.
fast, medium, slow: User-defined lengths for three different EMAs (100, 200, 500 by default).
📊 What It Does:
Computes Exponential Moving Averages (EMAs) of the delta to smooth short-, medium-, and long-term shifts in orderflow.
Plots
fastMA (Red): Tracks short-term shifts in buy/sell pressure.
mediumMA (Orange): Mid-term trend.
slowMA (Green): Long-term buy/sell dominance.
📈 Use Case:
Detect sustained buying or selling pressure.
Identify trend reversals, divergences, or volume-based confirmation of price moves.
Useful for orderflow-based swing or intraday strategies.
The information and publications are not meant to be, and do not constitute, financial, investment, trading, or other types of advice or recommendations supplied or endorsed by GoCharting. Read more in the Terms of Use.
Related Scripts
Comments (0)
Loading comments…