The primary tab displays XAUUSD, but the layout contains two split 5-minute charts: BINANCE:BTCUSDT on the left and OANDAMT:XAUUSD on the right. News Driver: Both charts display a news event marker (

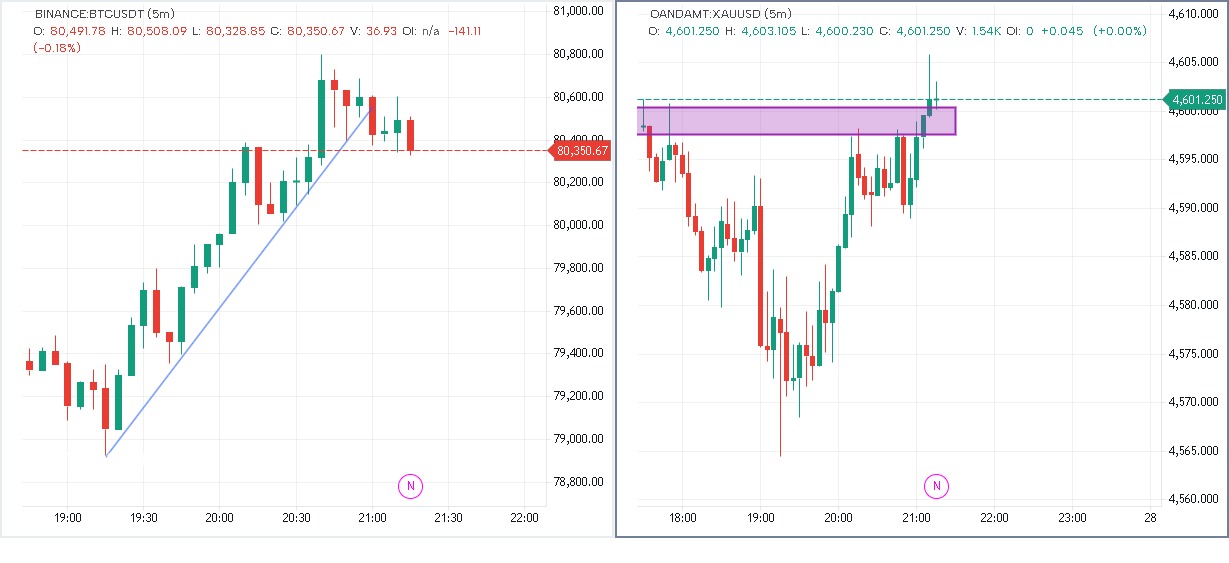
Left Chart: BINANCE:BTCUSDT (5m)
Trendline Breakdown: BTC staged an aggressive impulse up to ~$80,750 before losing momentum. Price broke cleanly below the ascending blue support trendline.
Bearish Follow-Through: The breakdown candle is followed by tight, indecisive red candles failing to reclaim the trendline, currently trading at 80,389.64.
Immediate Risk: Failure to reclaim 80,500 opens a retest of the prior consolidation base around 80,000–79,800.
Right Chart: OANDAMT:XAUUSD (5m)
Resistance Liquidity Sweep: Gold completed a deep V-shape recovery from the 4,565 lows into the shaded purple resistance zone (4,598–4,602).
Wick Rejection at Key Level: Price spiked to a high of ~4,608 to sweep liquidity above resistance, but the candle pulled back, leaving a massive upper wick and currently closing back down near 4,601.35.
Immediate Risk: This is a classic liquidity grab/exhaustion signature at resistance. If the next 5m candle fails to hold above 4,600, expect a sharp mean reversion back toward the 4,585–4,590 order block.
Key Takeaways
BTCUSDT: Short-term trend failure; momentum favors bears unless 80,550 is reclaimed on volume.
XAUUSD: Trapped aggressive breakout buyers with a long wick at major resistance; high probability of a corrective pullback.
The information and publications are not meant to be, and do not constitute, financial, investment, trading, or other types of advice or recommendations supplied or endorsed by GoCharting. Read more in the Terms of Use.
Comments (0)
Loading comments…