Multi-Factor Trend Confluence – Bull & Sell Signals

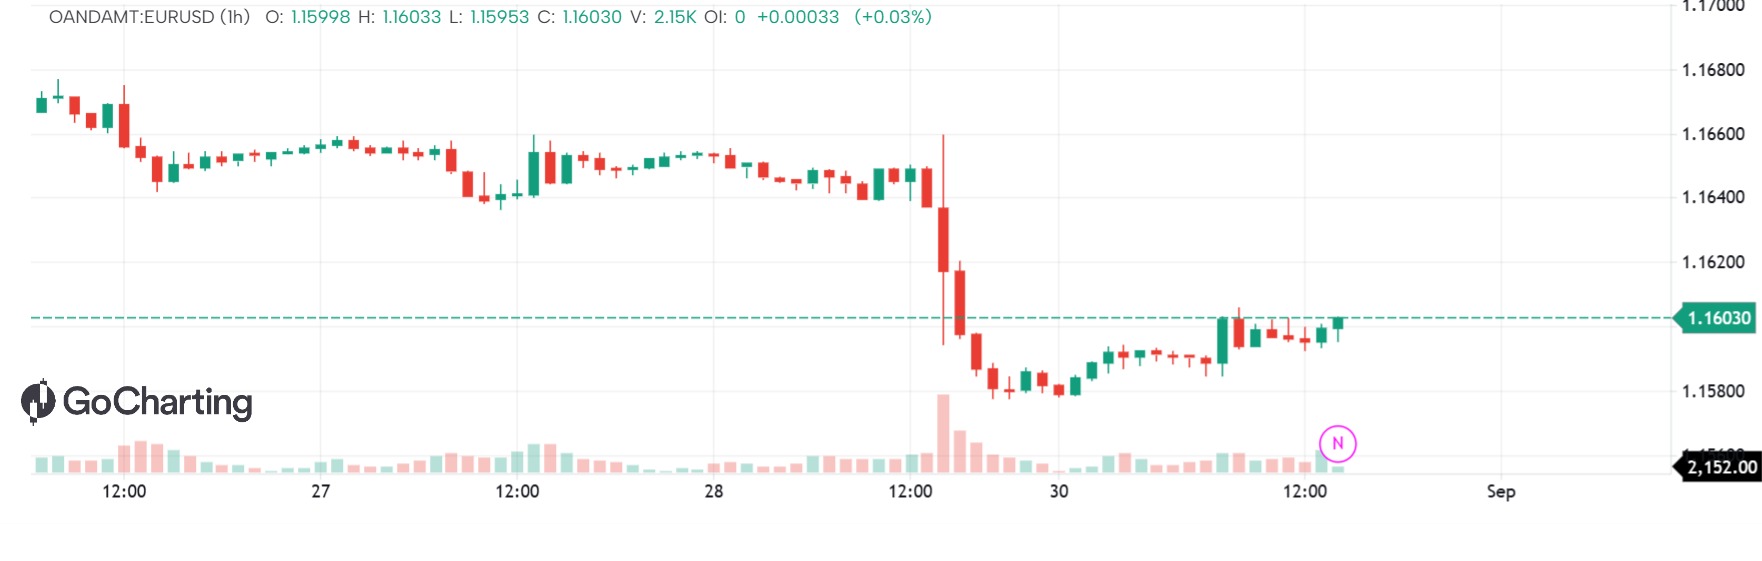
Multi-Factor Trend Confluence – Bull & Sell Signals is a trend-following confirmation indicator designed to identify higher-quality bullish and bearish trading opportunities while filtering out weaker market signals.
The indicator combines four independent areas of technical confirmation:
1. Trend Direction
A 21-period EMA and 55-period EMA determine the intermediate trend.
Bullish conditions require the fast EMA to remain above the slow EMA.
Bearish conditions require the fast EMA to remain below the slow EMA.
2. Long-Term Trend Filter
A 200-period EMA acts as the primary market regime filter.
Bull signals are considered only when price is above the 200 EMA.
Sell signals are considered only when price is below the 200 EMA.
This helps avoid taking signals directly against the dominant trend.
3. Momentum Confirmation
RSI is used to confirm directional momentum.
By default, bullish momentum requires RSI above 55.
Bearish momentum requires RSI below 45.
The neutral area between these levels helps filter sideways conditions.
4. MACD Momentum Confirmation
MACD-style momentum is calculated using 12 and 26 period EMAs together with a 9-period signal EMA.
Bullish setups require the MACD line to be above its signal line and above zero.
Bearish setups require the MACD line to be below its signal line and below zero.
Optional Volume Confirmation:
Traders can enable the volume filter to require current volume
to exceed its 20-period moving average before a signal is accepted.
This can help filter price movements occurring on relatively weak volume.
Bull Signal:
A BULL signal appears when bullish trend, long-term trend,
RSI momentum, MACD momentum, and the optional volume condition
simultaneously agree.
A new marker is generated only when the complete bullish setup
transitions from false to true.
Sell Signal:
A SELL signal appears when bearish trend, long-term trend,
RSI momentum, MACD momentum, and the optional volume condition
simultaneously agree.
A new marker is generated only when the complete bearish setup
transitions from false to true.
Chart Interpretation:
Green bars indicate that the complete bullish setup is active.
Red bars indicate that the complete bearish setup is active.
The 21 EMA provides the faster trend reference.
The 55 EMA provides intermediate trend confirmation.
The 200 EMA represents the broader directional filter.
Suggested Usage:
The indicator is designed as a confirmation system rather than
a prediction system.
Signals will generally be more selective because several conditions
must agree before a BULL or SELL marker is produced.
Settings should be tested and optimized for the instrument,
timeframe, volatility environment, and trading style being used.
Important:
No technical indicator can guarantee a fixed accuracy such as 60%
across every instrument and timeframe.
Historical and forward testing should be used to evaluate signal
performance before the indicator is incorporated into a trading system.
Disclaimer:
This indicator is intended for educational and analytical purposes only. It does not constitute financial advice or a guarantee of future results.
indicator("Multi-Factor Trend Confluence – Bull & Sell Signals", shorttitle="MTC Bull/Sell", overlay=true)
The information and publications are not meant to be, and do not constitute, financial, investment, trading, or other types of advice or recommendations supplied or endorsed by GoCharting. Read more in the Terms of Use.
Comments (0)
Loading comments…